Keywords: identifiability | mcmc | bayesian | Download Notebook
Contents
%matplotlib inline
import numpy as np
import scipy as sp
import matplotlib as mpl
import matplotlib.cm as cm
import matplotlib.pyplot as plt
import pandas as pd
pd.set_option('display.width', 500)
pd.set_option('display.max_columns', 100)
pd.set_option('display.notebook_repr_html', True)
import seaborn as sns
sns.set_style("whitegrid")
sns.set_context("poster")
We generate some test data from $N(0,1)$:
from scipy.stats import norm
data = norm.rvs(size=100)
data
array([  1.36915564e+00,   1.05529290e+00,  -4.60818168e-01,
         4.43641268e-01,   1.04113884e+00,   5.37649494e-01,
         7.60942560e-01,  -1.19804968e+00,   2.60566303e-01,
        -1.59689277e-01,   1.20547931e+00,   5.49728756e-01,
        -3.98610594e-01,   1.17620621e+00,  -1.02786937e-01,
         5.69037802e-01,  -6.01246985e-01,  -1.13331329e+00,
         8.54294530e-01,  -3.08324755e-01,   1.70618430e-01,
         4.51807215e-01,  -9.09119383e-02,  -1.78929328e-01,
         5.08269848e-01,  -1.24816874e+00,   4.75595913e-01,
         1.54785631e+00,  -4.71245561e-01,   1.62311337e+00,
        -3.41351283e-01,  -1.80469802e-01,   2.11632172e+00,
         8.41353133e-01,  -7.59104066e-01,  -1.55689174e+00,
        -2.41292745e-01,   2.24845053e-01,   3.91140426e-01,
        -6.85331082e-01,   5.79668372e-01,   8.36376400e-01,
        -2.54014208e-01,   1.75048511e+00,  -3.77872885e-01,
        -1.25172135e+00,  -2.17600397e-01,   3.15190627e-01,
         3.09352205e-01,   5.82187822e-03,   8.46971134e-01,
        -1.27378792e+00,  -1.58238529e+00,   3.79882049e-01,
         4.05398087e-01,  -5.24250939e-01,   1.82095389e-01,
        -1.44264482e+00,  -8.30774322e-01,  -1.53947998e+00,
         3.71236071e-01,  -8.84748037e-01,   5.15176219e-01,
         2.75972541e-01,  -7.00062965e-01,   1.48180541e+00,
         2.61253233e-01,  -1.14039049e-01,   8.74695837e-01,
         2.92856746e+00,  -9.60566331e-01,   1.50764549e-01,
        -1.95244936e-03,   6.28764490e-01,   9.96449749e-01,
         6.79706207e-01,   1.79320769e-01,   5.80139066e-01,
        -5.35478677e-01,   1.42260090e+00,  -1.54703643e-01,
         3.67620982e-01,   6.78943636e-01,  -8.96368493e-01,
        -4.90099004e-01,  -7.11463855e-01,  -1.57853576e+00,
         2.33149688e+00,  -6.36936390e-01,   4.93011087e-01,
        -1.55102354e-01,   6.52594170e-01,   2.07283645e+00,
        -1.41202558e+00,  -7.99693611e-01,  -5.45509876e-01,
         1.20850780e+00,   7.32805993e-01,  -6.08890816e-01,
         4.91920477e-01])
We fit this data using the following model:
\[y \sim N(\mu, \sigma)\\ \mu = \alpha_1 + \alpha_2\\ \alpha_1 \sim Unif(-\infty, \infty)\\ \alpha_2 \sim Unif(-\infty, \infty)\\ \sigma \sim HalfCauchy(0,1)\]import pymc3 as pm
In our sampler, we have chosen njobs=2 which allows us to run on multiple processes, generating two separate chains.
with pm.Model() as ni:
    sigma = pm.HalfCauchy("sigma", beta=1)
    alpha1=pm.Uniform('alpha1', lower=-10**6, upper=10**6)
    alpha2=pm.Uniform('alpha2', lower=-10**6, upper=10**6)
    mu = pm.Deterministic("mu", alpha1 + alpha2)
    y = pm.Normal("data", mu=mu, sd=sigma, observed=data)
    stepper=pm.Metropolis()
    traceni = pm.sample(100000, step=stepper, njobs=2)
Multiprocess sampling (2 chains in 2 jobs)
CompoundStep
>Metropolis: [alpha2]
>Metropolis: [alpha1]
>Metropolis: [sigma]
Sampling 2 chains: 100%|██████████| 201000/201000 [01:09<00:00, 2875.45draws/s]
The gelman-rubin statistic is larger than 1.2 for some parameters.
The estimated number of effective samples is smaller than 200 for some parameters.
pm.model_to_graphviz(ni)
pm.summary(traceni)
| mean | sd | mc_error | hpd_2.5 | hpd_97.5 | n_eff | Rhat | |
|---|---|---|---|---|---|---|---|
| sigma | 0.929859 | 0.067029 | 0.000488 | 0.798521 | 1.059213 | 21927.306462 | 1.000014 |
| alpha1 | 0.965169 | 1.275430 | 0.125124 | -1.363886 | 3.242092 | 3.084729 | 1.371864 |
| alpha2 | -0.829637 | 1.276056 | 0.125050 | -3.128876 | 1.486237 | 3.073467 | 1.372306 |
| mu | 0.135532 | 0.091854 | 0.001345 | -0.037689 | 0.322161 | 4918.178358 | 1.000050 |
pm.traceplot(traceni);
//anaconda/envs/py3l/lib/python3.6/site-packages/matplotlib/axes/_base.py:3449: MatplotlibDeprecationWarning:
The `ymin` argument was deprecated in Matplotlib 3.0 and will be removed in 3.2. Use `bottom` instead.
  alternative='`bottom`', obj_type='argument')

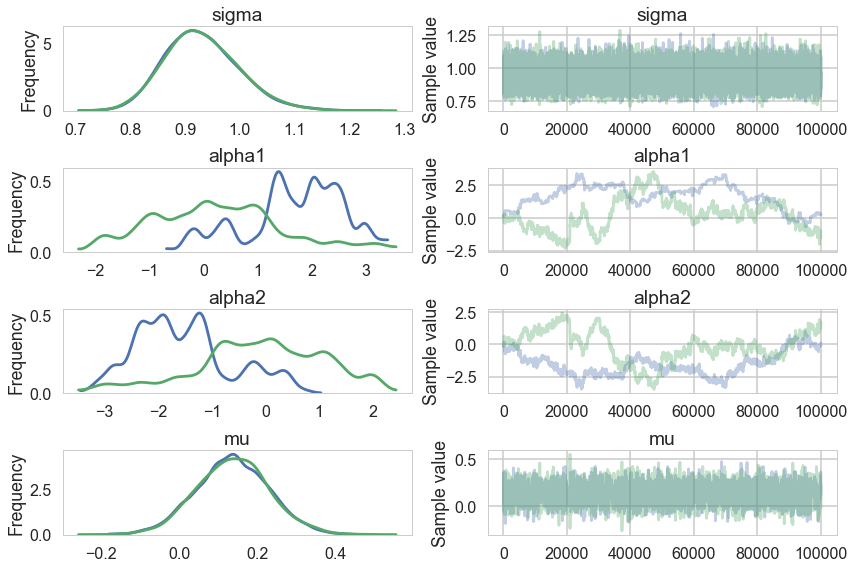
Look at our traces for $\alpha_1$ and $\alpha_2$. These are bad, and worse, they look entirely different for two chains. Despite this, $\mu$ looks totally fine. Our trac
df=pm.trace_to_dataframe(traceni)
df.corr()
| sigma | alpha1 | alpha2 | mu | |
|---|---|---|---|---|
| sigma | 1.000000 | 0.001891 | -0.002385 | -0.006882 |
| alpha1 | 0.001891 | 1.000000 | -0.997408 | 0.029191 |
| alpha2 | -0.002385 | -0.997408 | 1.000000 | 0.042806 |
| mu | -0.006882 | 0.029191 | 0.042806 | 1.000000 |
Just like in our uncentered regression example, we have $\alpha_1$ and $\alpha_2$ sharing information: they are totally negatively correlated and unidentifiable. Indeed our intuition probably told us as much.
pm.autocorrplot(traceni)
array([[<matplotlib.axes._subplots.AxesSubplot object at 0x11c706198>,
        <matplotlib.axes._subplots.AxesSubplot object at 0x11cb94240>],
       [<matplotlib.axes._subplots.AxesSubplot object at 0x11cbe0390>,
        <matplotlib.axes._subplots.AxesSubplot object at 0x11cd9e470>],
       [<matplotlib.axes._subplots.AxesSubplot object at 0x11ce6f160>,
        <matplotlib.axes._subplots.AxesSubplot object at 0x11c69f4a8>],
       [<matplotlib.axes._subplots.AxesSubplot object at 0x11f4d8438>,
        <matplotlib.axes._subplots.AxesSubplot object at 0x11e706780>]], dtype=object)

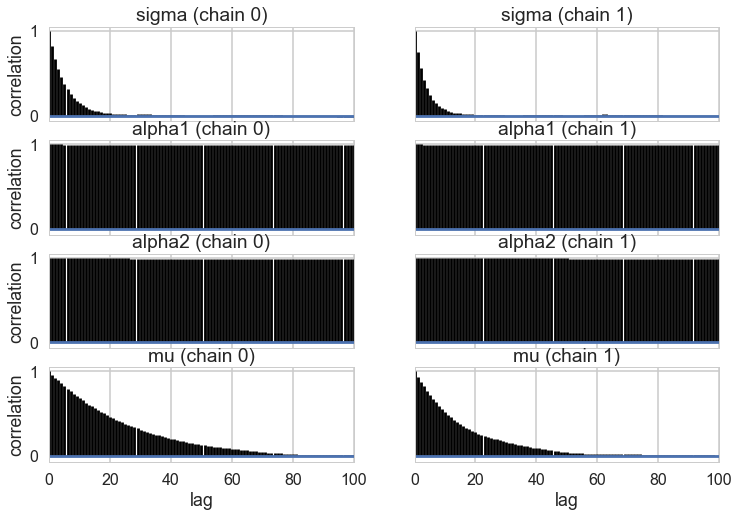
A look at the effective number of samples using two chains tells us that we have only one effective sample for $\alpha_1$ and $\alpha_2$.
pm.effective_n(traceni)
{'alpha1': 3.0847290976843218,
 'alpha2': 3.0734670584705572,
 'mu': 4918.1783580295532,
 'sigma': 21927.306461639713}
The Gelman-Rubin statistic is awful for them. No convergence.
pm.gelman_rubin(traceni)
{'alpha1': 1.3718637421441382,
 'alpha2': 1.3723057686966671,
 'mu': 1.0000502933374407,
 'sigma': 1.0000144819583978}
Its going to be hard to break this unidentifiability. We try by forcing $\alpha_2$ to be negative in our prior
with pm.Model() as ni2:
    sigma = pm.HalfCauchy("sigma", beta=1)
    alpha1=pm.Normal('alpha1', mu=5, sd=1)
    alpha2=pm.Normal('alpha2', mu=-5, sd=1)
    mu = pm.Deterministic("mu", alpha1 + alpha2)
    y = pm.Normal("data", mu=mu, sd=sigma, observed=data)
    #stepper=pm.Metropolis()
    #traceni2 = pm.sample(100000, step=stepper, njobs=2)
    traceni2 = pm.sample(100000)
Auto-assigning NUTS sampler...
Initializing NUTS using jitter+adapt_diag...
Multiprocess sampling (2 chains in 2 jobs)
NUTS: [alpha2, alpha1, sigma]
Sampling 2 chains: 100%|██████████| 201000/201000 [08:29<00:00, 394.59draws/s]
pm.model_to_graphviz(ni2)
Notice we are using the built in NUTS sampler. It takes longer but explores the distributions far better. This is directly related to our priors imposing regions. I could not even run the previous sampler in any reasonable time in NUTS.
pm.traceplot(traceni2);
//anaconda/envs/py3l/lib/python3.6/site-packages/matplotlib/axes/_base.py:3449: MatplotlibDeprecationWarning:
The `ymin` argument was deprecated in Matplotlib 3.0 and will be removed in 3.2. Use `bottom` instead.
  alternative='`bottom`', obj_type='argument')

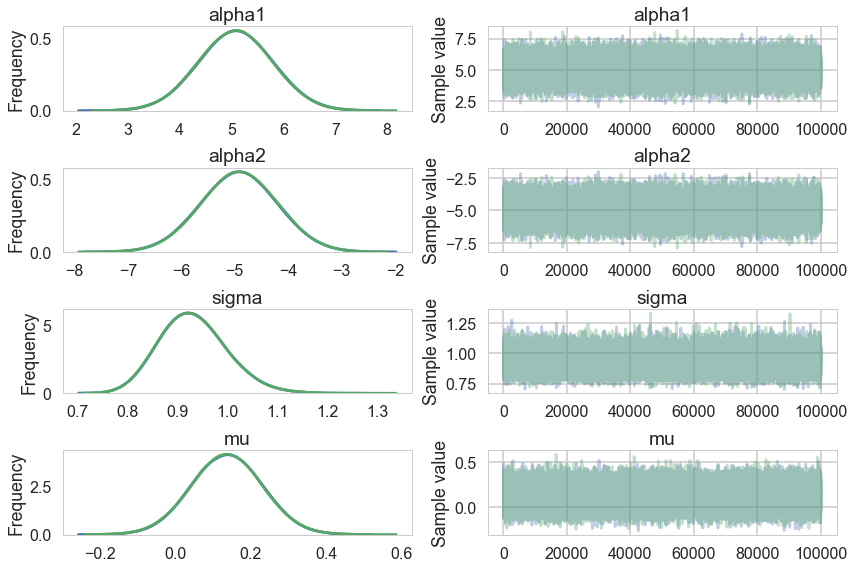
Our extremely strong priors have helped us do a much better job.
pm.summary(traceni2)
| mean | sd | mc_error | hpd_2.5 | hpd_97.5 | n_eff | Rhat | |
|---|---|---|---|---|---|---|---|
| alpha1 | 5.066310 | 0.708625 | 0.002569 | 3.678977 | 6.456753 | 77586.667382 | 1.000020 |
| alpha2 | -4.931296 | 0.708567 | 0.002562 | -6.333776 | -3.554861 | 77570.663271 | 1.000019 |
| sigma | 0.930199 | 0.066613 | 0.000198 | 0.805719 | 1.064302 | 96892.104502 | 0.999996 |
| mu | 0.135013 | 0.093098 | 0.000204 | -0.045187 | 0.319260 | 195950.078927 | 0.999996 |
Our effective sample size is still poor and our traces still look dodgy, but things are better.
pm.effective_n(traceni2)
{'alpha1': 77586.667381948821,
 'alpha2': 77570.663270675213,
 'mu': 195950.07892697665,
 'sigma': 96892.104501958092}
pm.gelman_rubin(traceni2)
{'alpha1': 1.0000203740430271,
 'alpha2': 1.000018798766553,
 'mu': 0.99999646960401545,
 'sigma': 0.99999594999714658}
..and this shows in our Gelman-Rubin statistics as well…
pm.trace_to_dataframe(traceni2).corr()
| alpha1 | alpha2 | sigma | mu | |
|---|---|---|---|---|
| alpha1 | 1.000000 | -0.991369 | -0.003822 | 0.066316 |
| alpha2 | -0.991369 | 1.000000 | 0.003936 | 0.065067 |
| sigma | -0.003822 | 0.003936 | 1.000000 | 0.000868 |
| mu | 0.066316 | 0.065067 | 0.000868 | 1.000000 |
..but our unidentifiability is still high when we look at the correlation. This reflects the fundamental un-identifiability and sharing of information in our model since $\mu = \alpha_1 +\alpha_2$: all the priors do is artificially peg one of the parameters. And once one is pegged the other is too because of the symmetry.